
The Call Graph
A view of program structure

You have a program. The program is divided up into a bunch of functions. Once it grows beyond a certain size, you can’t keep it all in your head at once, and navigating it starts to feel bewildering. How do you make sense of it all?
In the inaugural post, I mentioned that I’m going to be writing about views for understanding software and techniques for changing it. In this post, I’d like to introduce our first view: the call graph.
But first: what’s a graph?
Graphs
Computer scientists loooove graphs. No, not graphs of lines on the x-y plane. For some reason they decided to use the same word to mean a totally different thing. To a computer scientist, a graph is a network. You can imagine a graph as a bunch of things (let’s call ‘em nodes, but you can picture circles or whatever) that can have connections or arcs (imagine arrows) between them.

We can draw graphs representing all kinds of real-world systems. For example, you can draw a graph where the nodes represent people on Mastodon and the arrows represent a “follows” relationship. Or, you might draw a graph where the nodes represent computers and the arrows represent the relationship “A is connected directly to B over a network”. Draw that graph for all the computers on Earth and you’d have a map of the Internet.
Once we have a graph representing our object of interest, we can use it to answer questions. For example, we can ask whether the graph has any cycles in it, where we can get from some node A back to A by following the arrows. The graph I drew above has a cycle. Here’s one that doesn’t have any cycles:

We can also ask statistical questions like “how many arrows does the average node have going out of it?” and “how many arrows does the average node have going into it?”. These questions might be interesting, for example, if our graph represents a social network—they’d tell us how many followers the average user has, and how many people each user follows, on average.
In summary, we can draw a graph of something if we can identify:
what the nodes represent. What type of thing are we talking about?
what the arrows represent. What does it mean if there’s an arrow from A to B?
We make graphs so we can model the world and answer questions about it.
The Call Graph
Now let’s apply what we know about graphs to understanding a complex program.
We can draw a graph where each node represents a function in our program. We draw an arrow from function A to function B if A calls B.
If you draw this graph for a typical smallish program (say, 10 functions or so) what you’re likely to find is that there aren’t any cycles in the graph. It might look something like this:
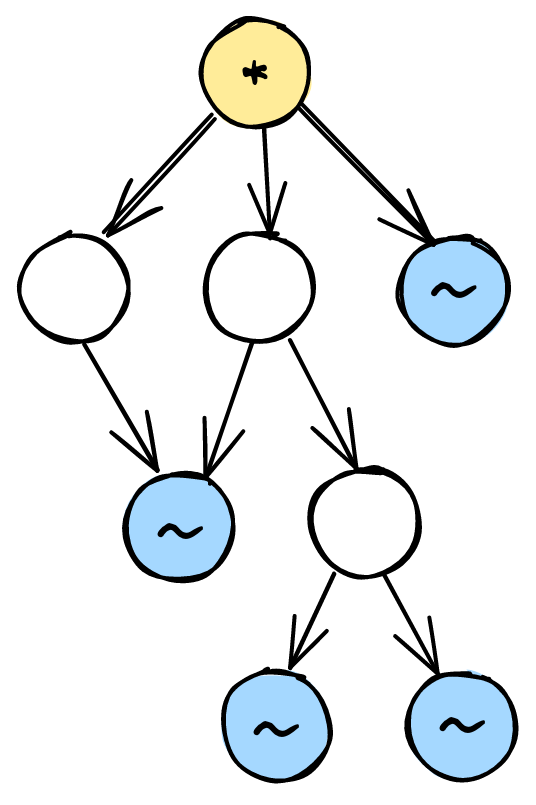
The yellow node marked with a star represents a function that isn’t called by anything else in the program. We can tell because it has no arrows going into it—it’s a root node. The blue nodes marked with squiggles are functions that don’t call any other functions, so they have no arrows going out—they’re leaf nodes.
Using the call graph
Now that we’ve drawn out this graph, we’re better equipped to answer questions like:
What other functions might be invoked if I call function
foo? (we can answer this by following the arrows starting fromfoo).If I make a change to function
bar, what other functions might have their behavior altered? (we can answer this by following the arrows backwards starting frombar).
Drawing the graph also helps us understand the program more holistically. Maybe, once we’ve drawn the graph, we notice that the functions partition nicely into groups:

Seeing these groups can spark an “aha!” moment where we gain insight into the different parts of the program and how they relate. On the other hand, if there are no clear groupings of functions, that might be a sign that the code is in need of some reorganization.
Call graphs can also help us make sense of the daily frustrations of software development, reinforcing our confidence that the problem isn’t us, it’s the code. Draw a few call graphs of annoying code, and you’ll soon notice recurring patterns. “Oh, there are six functions with similar names that all call each other? That’s why this code is so hard to understand!” “This function calls the database and does a bunch of complex calculations? No wonder it’s hard to test!”
Finally, having a call graph of unfamiliar code can help us decide in what order to read the functions. Want a top-down overview of what the code does? Start from the root node, and work your way down, following the arrows. Maybe you’d rather start with the fundamentals and build up? Read the leaf nodes first, and work your way towards the root, following the arrows backwards.
Do I actually do this?
Every few months or so, I feel the need to draw out a call graph for a section of code on paper. When I do, I take it as a strong signal that the code is a mess. I might do one of several things in response to that signal—I might take extra care in testing, or I might try to refactor it so it’s less of a mess. No matter what I decide to do, the graph is invariably a help as I navigate the code.
Much more often, I imagine call graphs in my head. I have a set of idealized call graphs—let’s call ‘em call graph patterns—that I “project” onto code that I’m writing. I know that these patterns usually result in code that’s easy to understand and change, so if I can fit the code I’m writing into a pattern, the result is more likely to be good.
I’ll write more about these patterns in future posts, but here are a couple brief whiffs, just to whet your appetite:


If you’d like to be notified by email when I write more about these, you can subscribe to this newsletter:
Happy graphing!
Graphs in the xy plane tend to be called plots by mathematics people. Just, FYI.
When you draw out call graphs, do you do that based on reading the code and working through the dependency graph? Or do you have another technique?